Data plots
This example illustrates data plotting for summary statistics of observed vs. simulated data. This can be used for easy assessment of how good we can fit the data.
Let’s start to import the necessary classes. We also set up matplotlib and we’re going to use numpy and pandas as well.
[ ]:
# install if not done yet
!pip install pyabc --quiet
[1]:
import matplotlib.pyplot as plt
import numpy as np
import pandas as pd

from pyabc.visualization import plot_data_default
Define summary statistics
First, we will define some arbitrary summary statistics to be used in this example. We will define different summary statistics with different data types. Data types of the value of the summary statistic can be 1d numpy array, 2d numpy array, pandas data frame.
[2]:
observed = {
    'data 1': np.array([1, 1, 2, 2, 3, 3, 4, 4]),
    'data 2': pd.DataFrame({'measurement': [1, 2, 3, 4, 1, 2, 3, 4]}),
    'data 3': pd.DataFrame(
        {
            'measurement 1': [1, 2, 3, 4, 1, 2, 3, 4],
            'measurement 2': [1, 5, 4, 6, 7, 2, 6, 2],
        }
    ),
    'data 4': np.array([[4, 4, 5, 3, 2, 2, 1, 2], [4, 3, 4, 3, 1, 1, 2, 1]]),
    'data 5': np.array([1, 1, 2, 2, 3, 3, 4, 4]),
}
We do the same for the simulated data:
[3]:
simulated = {
    'data 1': np.array([1, 2, 4, 6, 8, 10, 12, 14]),
    'data 2': pd.DataFrame({'measurement': [1, 2, 4, 6, 1, 2, 4, 6]}),
    'data 3': pd.DataFrame(
        {
            'measurement 1': [2, 3, 4, 5, 3, 4, 1, 2],
            'measurement 2': [1, 6, 5, 4, 6, 2, 5, 2],
        }
    ),
    'data 4': np.array(
        [[13, 13, 9, 7, 8, 3, 2, 1], [14, 12, 10, 9, 6, 4, 3, 2]]
    ),
    'data 5': np.array([1, 2, 4, 6, 8, 10, 12, 14]),
}
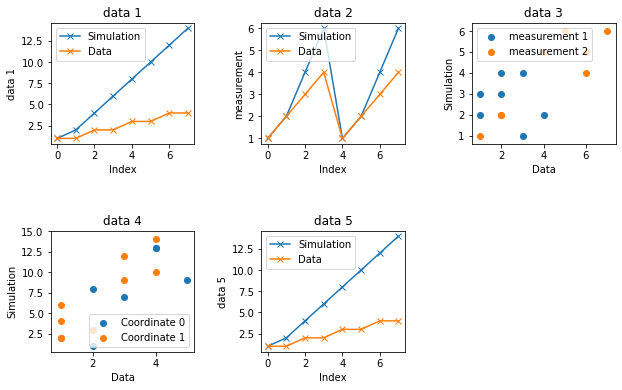
Plot
Now that we have defined two dictionaries for both the observed and simulated summary statistics, we can call the plotting function from pyABC.visualization
[4]:
plot_data_default(observed, simulated)
plt.gcf().set_size_inches(9, 6)
plt.show()
Note that there is also a function pyabc.visualization.plot_data_callback operating via callback functions and thus allowing more flexibility. This function is illustrated in the conversion reaction notebook.